witec360 ラマン顕微鏡とHexalight分光器の発売開始
新たなラマンイメージングの基準で、あらゆる方向へ研究を進めましょう


関連: 地質・岩石学、鉱業
SEMベースのEDSとEBSD分析を用いて、地殻内の地質学的プロセスに対する岩石の応答をマイクロスケールで分析
An understanding of the way rocks react to stresses at high temperatures and pressures allows geologists to predict, with greater certainty, processes that occur at the surface of the Earth. This can benefit society in many ways, including allowing better forecasting of catastrophic geological events such as earthquakes or volcanic eruptions and enabling suitable sites to be chosen for hazardous waste storage. However, rocks, by their nature, tend to be chemically and crystallographically complex and this makes predicting their response to external stresses particularly challenging.
In order to develop accurate models, geoscientists need to understand the processes that occur at the grain scale; microanalysis systems on a scanning electron microscope (SEM) are ideal for this, in particular, electron backscatter diffraction (EBSD) and energy dispersive X-ray spectrometry (EDS). EBSD and EDS are complementary techniques, providing high-resolution information about the rock’s composition, mineralogy and grain structure. These data are used by researchers to understand the complex interaction between deformation, metamorphic conditions and the role of fluids in a wide range of rocks, which can then be used to refine large-scale geodynamic models.
Recent developments in detector and software technology now enable full sample characterisation within a few hours. The illustrated example is taken from a drill core sample of a deformed region in the lower oceanic crust. The results clearly illustrate the different response of mineral phases to deformation, with larger Ca-rich pyroxenes supported in a weaker matrix of ultra-fine grained Ca-poor plagioclase feldspar.
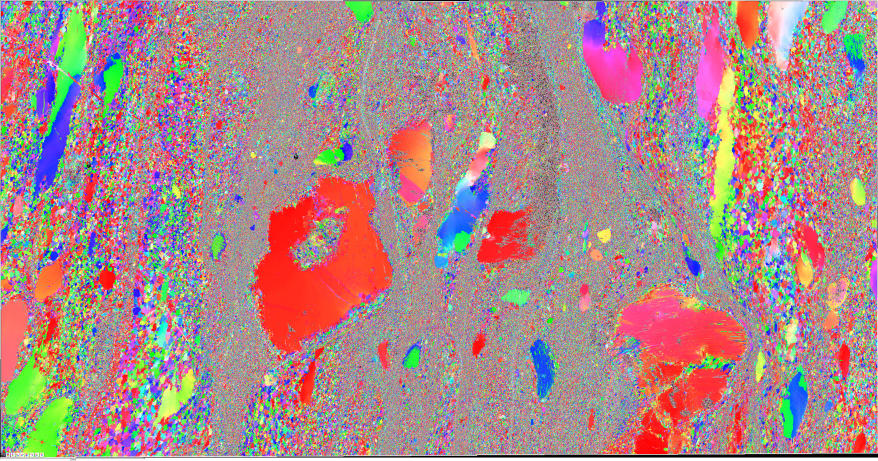
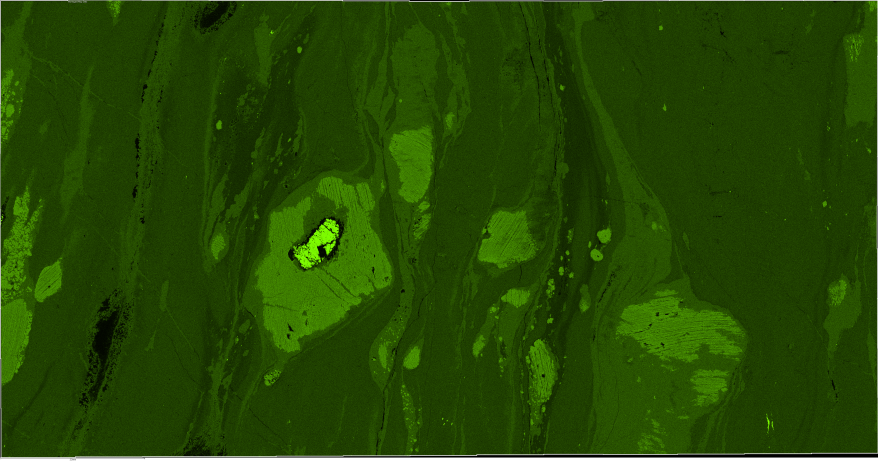
The above image shows an EBSD orientation map (left) and EDS Ca distribution map (right) of a polished section of deformed lower oceanic crust gabbro, collected using the AZtec Synergy software with a Symmetry EBSD detector and an X-Max 150 EDS detector. The field of view is 15 mm across.
© オックスフォード・インストゥルメンツ 2026